(Analyze), it will break down the percentage of those items in comparison to the ENTIRE job. For example – Material Cost of $9,376 of $85,128 and labor of 120 hours of 662.95 hours, this displays a pie chart of 11% for Material and 18% for Labor:
The Edit >> Analyze function compares the selected items to the entire Summary file and shows in a pie chart and in numbers the value of the selected items in relation to the total of all the items. This feature provides a way for you to quickly analyze an Estimate; identifying the items that comprise the majority of the Estimate and checking to ensure the pricing is accurate. There are two methods that can be used to accomplish this and each is detailed in Analyze Example 1 and Analyze Example 2.
Note: The Analyze examples are for the Summary folder, however, the procedures for Analyze in the Subtotals and Phases folders are similar.
Also, note that Analyze does not always calculate totals for the entire Summary report, but rather the selected breakout(s).
For example, if you are breaking out by Section, select the Section 1 group node and click Analyze to see what percentages that all of the items under that group node represent. However, if the Summary folder is selected, then Analyze will show totals for the entire Summary.
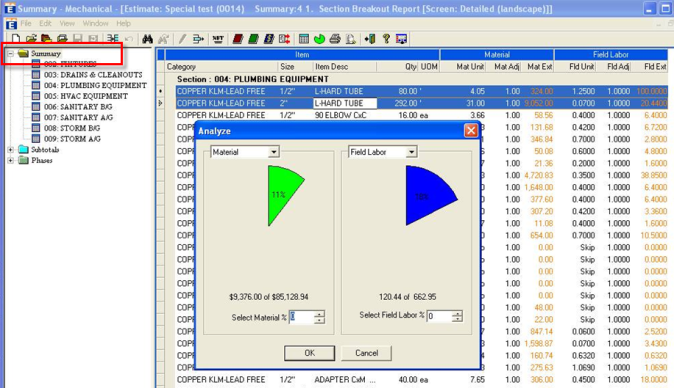
When the Summary folder is highlighted and you select an item or a group of items and click (Analyze), it will break down the percentage of those items in comparison to the ENTIRE job. For example – Material Cost of $9,376 of $85,128 and labor of 120 hours of 662.95 hours, this displays a pie chart of 11% for Material and 18% for Labor:
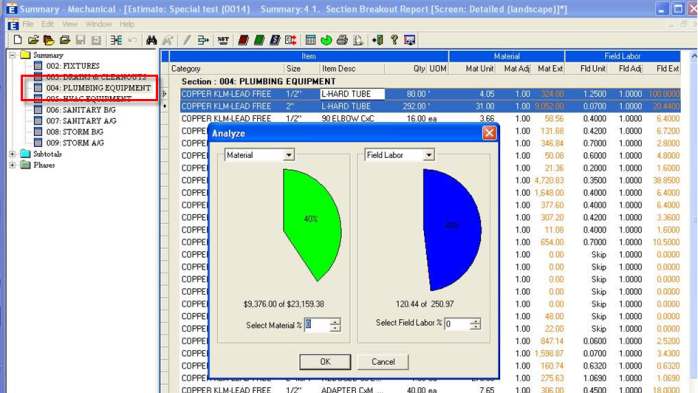
When the Section folder is highlighted and you select an item or a group of items and click (Analyze), it will break down the percentage of those items in comparison to the Total Section for that particular job. For example – Material Cost of $9,376 of $23,159 and labor of 120 hours of 250.97 hours, this displays a pie chart of 40% for Material and 48% for Labor: