Levels
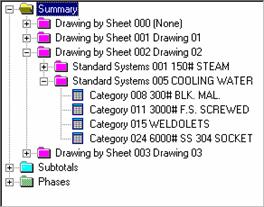
The Levels window can be a little intimidating at first glance. What Levels controls is the amount of breakdown you would like for the Summary. There can be up to 20 tiers of breakdown. After the Summary is run, when the Summary file displays, you will see these levels represented as a "tree view" on the left side of the Summary File Maintenance (SFM) window (example in Figure 1).
This example shows that the Summary was run with three levels: Drawings, Standard Systems, and Category. Notice that Drawings is the first level, with Systems as the second level and Category as the third level. Levels are tiered according to their selected order. Therefore, the Category level is a sub-level to Systems; Systems is a sub-level to Drawings. If a fourth level had been chosen, it would be a sub-level to Category, and so on.
Figure 1
Once you select a level, notice that the choices in the Sorting & Filtering window change. Figure 2 shows Category, with category descriptions displayed in Sorting & Filtering.
Figure 2
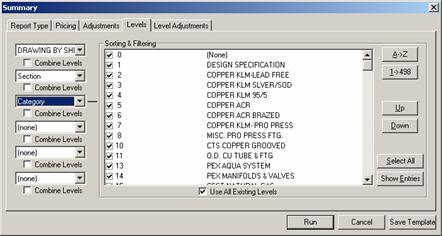
The Sorting & Filtering is a way of further narrowing down your Summary. You can either leave all of the descriptions (Drawings, Standard Systems, Categories, Installation Codes, etc.--whatever level is displayed) selected, or you can pick and choose just certain ones to be included. You can also use the ![]() and
and ![]() buttons to shuffle
the descriptions, determining in what order they appear in the Summary.
buttons to shuffle
the descriptions, determining in what order they appear in the Summary.
This is another way that different Report Types come in handy. You could setup different Report Types containing all Systems or just certain Systems. Summary is very flexible and very customizable to your specific requirements.